
Querying Inventory Data in Custom Reports
Overview
Custom reports are a great way for analyzing and communicating Enterprise Architecture insights of your organization in an effective way.
In this step-by-step tutorial we create a simple LeanIX custom report that demonstrates how to fetch data from the LeanIX workspace using the two methods provided by the LeanIX Reporting API: Facet Filters and GraphQL queries.
Pre-Requisites for this tutorial:
- NodeJS LTS installed in your computer.
- Javascript knowledge
- Vue framework knowledge
Getting Started
Initialize a new project by running the following command and answering the questionnaire. For this tutorial we will be using the vue template:
npm init lxr@latest
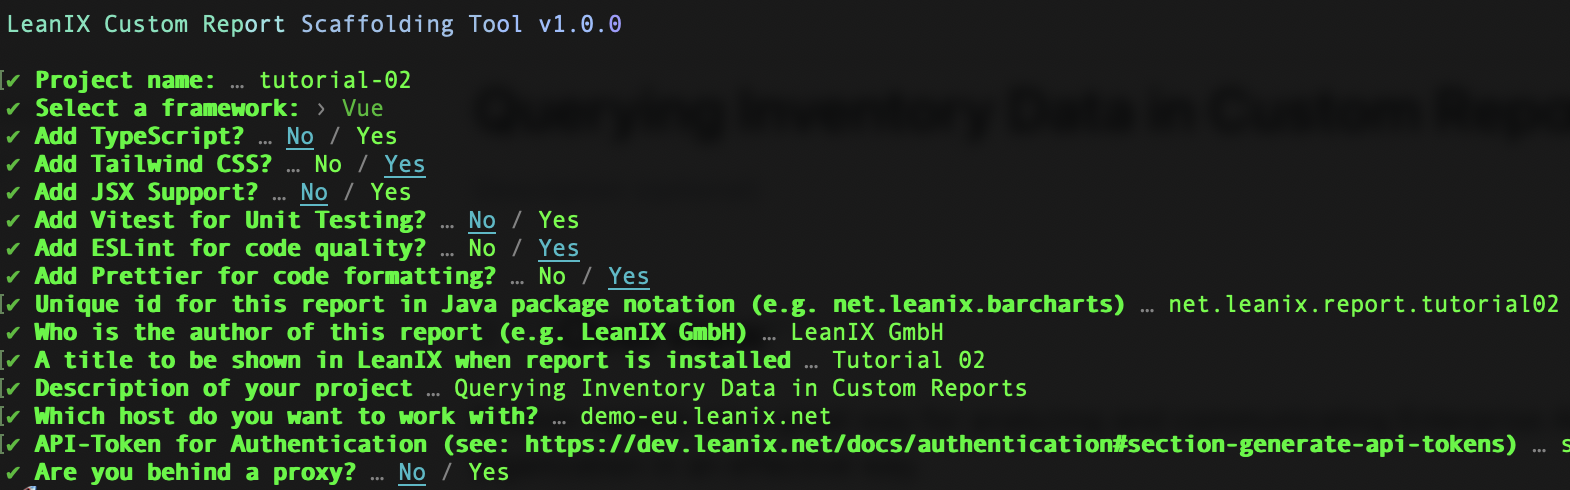
Answer the questionnaire as follows, making sure you answer the last three questions with the appropriate values for your workspace and network:
After this procedure, you should end up with the following project structure:

Finally, before proceeding, we'll delete the ./src/components/HelloWorld.vue file and edit the ./src/App.vue file as follows:
<template>
  <!-- we'll use this template tag for declaring our custom report html -->
  <div>Hi from LeanIX Custom Report</div>
</template>

<script setup>
  // all the state variables and business logic will be declared here
</script>
You may now start the development server now by running the following command:
npm run dev
Note!
When you run npm run dev, a local webserver is hosted on localhost:3000 that allows connections via HTTPS. But since just a development SSL certificate is created the browser might show a warning that the connection is not secure. You could either allow connections to this host anyways, or create your own self-signed certificate.
If you decide to add a security exception to your localhost, make sure you open a second browser tab and point it to https://localhost:3000. Once the security exception is added to your browser, reload the original url of your development server and open the development console. Your should see a screen similar to the one below:

Nothing very exciting happens here. Notice however that our report loads, and is showing the message we defined inside the template tag of the App.vue file.
Fetching workspace data using Facet Filters
Facet filtering is one of the two ways provided by the leanix-reporting api that can be used to fetch data from a workspace into a custom report. In this section we'll setup our report so that we can use facet filtering to compute the factsheet count and average completion ratio individually for each factsheet type defined in our workspace.
Setting up the report configuration
<script setup>
import '@leanix/reporting'
import { ref, watch } from 'vue'

// reactive variable that will hold the workspace factsheet types
const factSheetTypes = ref([])
// reactive variable that stores some statistics for each factsheet type
const facetResultIndex = ref({})

// we define our report initialization method, it is an async one so that we
// can syncronously await for Promise results
const initializeReport = async () => {
  // Intialize our reporting framework by calling the lx.init method
  // https://leanix.github.io/leanix-reporting/classes/lxr.lxcustomreportlib.html#init
  const setup = await lx.init()

  // we extract the workspace factsheet types from the setup object and store
  // it in our factSheetTypes reactive variable
  // more info on vue ref api found here:
  // https://v3.vuejs.org/guide/reactivity-fundamentals.html#creating-standalone-reactive-values-as-refs
  factSheetTypes.value = Object.keys(setup.settings.dataModel.factSheets)


  // we map each factsheet type into a report facet that we will use
  // to extract the relevant statistics from our workspace
  // https://leanix.github.io/leanix-reporting/interfaces/lxr.reportfacetsconfig.html
  const facets = factSheetTypes.value
    .map((factSheetType, key) => ({
      key: key.toString(),
      fixedFactSheetType: factSheetType,
      attributes: ['completion { completion }'],
      // everytime this facet gets updated, e.g. when the user sets a filter
      // the callback method will be triggered and the corresponding factsheet type key
      // in the facetResultIndex object will be updated as well
      callback: factSheets => {
        const factSheetCount = factSheets.length
        const averageCompletion = ((factSheets
          .reduce((accumulator, { completion }) => { return accumulator + completion.completion }, 0) / factSheetCount) * 100).toFixed(2) + '%'
        const facetResult = {
          label: lx.translateFactSheetType(factSheetType, 'plural'),
          factSheetCount,
          averageCompletion
        }
        facetResultIndex.value[factSheetType] = facetResult
      }
    }))
  // finally we call the lx.ready method with our report configuration
  // https://leanix.github.io/leanix-reporting/classes/lxr.lxcustomreportlib.html#ready
  lx.ready({ facets })
}

// we call our report initialization method here...
initializeReport()
</script>

<template>
  <!-- our template consists of a simple container that will display our facetResultsIndex variable -->
  <div class="container mx-auto h-screen">
    <div class="flex flex-wrap items-start justify-center">
      <div class="flex flex-col items-center">
        <span class="text-3xl font-bold uppercase py-4">Facets</span>
        <pre>{{facetResultIndex}}</pre>
      </div>
    </div>
  </div>
</template>
The factSheetTypes array contains all all factsheet types in our workspace. We'll hold the result of our completion analysis, for each factsheet type, in the facetResultIndex object. Moreover, we configure our report using the initializeReport method. We define a facet for each factsheet type in our workspace. The complete documentation for the leanix-reporting api can be found here.
Your report should now show the factSheetTypeIndex displayed in a pretty format:

Filtering and bookmarking
Filtering and bookmarking with Facet Filters is done out of the box, using the standard LeanIX Pathfinder controls and without requiring any modifications in the custom report source code. Filtering is done via the navigation panel on the left, by selecting the Filter tab and any combination of facets displayed below.

Once you set a combination of facet filters in your report, you can bookmark them by clicking on the "Save as" button on the top right corner and fill out the form details. Your bookmark will then be listed as a new report under the Reports tab of the left navigation column of the LeanIX Pathfinder application.

Fetching workspace data using GraphQL queries
Another way to fetch data from a workspace into a custom report is by using the lx.executeGraphQL method provided by the leanix-reporting api. Unlike the Facet Filter method we've seen before, which allows only data to be read from your workspace, the lx.executeGraphQL method allows also to mutate the workspace data. However, the integration of this method with the standard filtering and bookmarking controls is not out of the box like the Facet Filters method seen before. Nevertheless, it can be done with a special technique in our custom report, as we'll see ahead.
Setting up the report configuration
We edit once again the script section of our src/App.vue file and additionally declare the a variable graphQLResultIndex, a method fetchGraphQLData and a watcher for the variable factSheetTypes as follows:
<script setup>
import '@leanix/reporting'
import { ref, watch } from 'vue'

const factSheetTypes = ref([])
const facetResultIndex = ref({})

// reactive variable that stores some statistics for each factsheet type fetch through the GraphQL API
const graphQLResultIndex = ref({})

const initializeReport = async () => { /* no changes..., leave it as it is */ }

// this method will call the LeanIX GraphQL API and fetch a list of factsheets of a given type
const fetchGraphQLData = async factSheetType => {
  const query = 'query($factSheetType:FactSheetType){allFactSheets(factSheetType:$factSheetType){edges{node{completion{completion}}}}}'
  const queryResult = await lx.executeGraphQL(query, { factSheetType })
    .then(({ allFactSheets }) => {
      const factSheets = allFactSheets.edges.map(({ node }) => node)
      const factSheetCount = factSheets.length
      const averageCompletion = ((factSheets.reduce((accumulator, { completion }) => { return accumulator + completion.completion }, 0) / factSheetCount) * 100).toFixed(2) + '%'
      return {
        label: lx.translateFactSheetType(factSheetType, 'plural'),
        factSheetCount,
        averageCompletion
      }
    })
  return queryResult
}

// this watcher will be triggered whenever our factSheetTypes array variable gets updated
// and will update the graphQLResultIndex for every factSheetType in that array
watch(factSheetTypes, async factSheetTypes => {
  const factSheetTypeData = await Promise
    .all(factSheetTypes.map(factSheetType => fetchGraphQLData(factSheetType)))
  factSheetTypes
    .forEach((factSheetType, idx) => {
      graphQLResultIndex.value[factSheetType] = factSheetTypeData[idx]
    })
})

// we call our report initialization method here...
initializeReport()
</script>
We also adjust our template tag in src/App.vue so that a second column showing the contents of the graphQLResultIndex will be displayed:
<template>
  <div class="container mx-auto h-screen">
    <div class="flex flex-wrap items-start justify-center -mx-8 ">
      <div class="flex flex-col items-center px-8">
        <span class="text-3xl font-bold uppercase py-4">Facets</span>
        <pre>{{facetResultIndex}}</pre>
      </div>
      <div class="flex flex-col items-center px-8">
        <span class="text-3xl font-bold uppercase py-4">GraphQL</span>
        <pre>{{graphQLResultIndex}}</pre>
      </div>
    </div>
  </div>
</template>
Our report now should look like this:

As you can verify, the results provided by Facets and GraphQL are identical. However, if you try to apply a filter, you'll notice that only the Facets column changes. This happens because we are only triggering the fetchGraphQLData method whenever our factSheetTypes variables change, which only happens once the report loads. Therefore the GraphQL part of our report, as it is, does not react to any changes in the filters. However, the leanix-reporting api provides a way of listening to filter changes and trigger a callback through the facet configuration property facetFiltersChangedCallback. We'll adapt our source code to make our graphQL queries reactive to changes in filters.
For that, we'll adapt the initializeReport method and set, for each facet, a facetFiltersChangedCallback that will trigger the fetchGraphQLData method on each facet update, i.e. when the user sets a filter. Notice as well that we make a slight change in the fetchGraphQLData so to include in our query the facet filtering parameters passed by the callback. Finally note as well that we delete the watcher we previously set.
<script setup>

const factSheetTypes = ref([])
const facetResultIndex = ref({})
const graphQLResultIndex = ref({})

const initializeReport = async () => {
  const setup = await lx.init()

  factSheetTypes.value = Object.keys(setup.settings.dataModel.factSheets)

  const facets = factSheetTypes.value
    .map((factSheetType, key) => ({
      key: key.toString(),
      fixedFactSheetType: factSheetType,
      attributes: ['completion { completion }'],
      // the callback for changes in the facet filter that updates the graphQLResultIndex variable
      facetFiltersChangedCallback: async filter => {
        graphQLResultIndex.value[factSheetType] = await fetchGraphQLData(factSheetType, filter)
      },
      callback: factSheets => {
        const factSheetCount = factSheets.length
        const averageCompletion = ((factSheets
          .reduce((accumulator, { completion }) => { return accumulator + completion.completion }, 0) / factSheetCount) * 100).toFixed(2) + '%'
        const facetResult = {
          label: lx.translateFactSheetType(factSheetType, 'plural'),
          factSheetCount,
          averageCompletion
        }
        facetResultIndex.value[factSheetType] = facetResult
      }
    }))
  lx.ready({ facets })
}

// this method will call the LeanIX GraphQL API and fetch a list of factsheets of a given type
const fetchGraphQLData = async (factSheetType, filter) => {
  // Destructing assignment of filter object with alias for facets and fullTextSearch attributes
  const { facets: facetFilters, fullTextSearchTerm: fullTextSearch, directHits } = filter
  const mappedFilter = { facetFilters, fullTextSearch, ids: directHits.map(({ id }) => id) }
  const query = 'query($filter:FilterInput){allFactSheets(filter:$filter){edges{node{completion{completion}}}}}'
  const queryResult = await lx.executeGraphQL(query, { filter: mappedFilter })
    .then(({ allFactSheets }) => {
      const factSheets = allFactSheets.edges.map(({ node }) => node)
      const factSheetCount = factSheets.length
      const averageCompletion = ((factSheets.reduce((accumulator, { completion }) => { return accumulator + completion.completion }, 0) / factSheetCount) * 100).toFixed(2) + '%'
      return {
        label: lx.translateFactSheetType(factSheetType, 'plural'),
        factSheetCount,
        averageCompletion
      }
    })
  return queryResult
}

// we call our report initialization method here...
initializeReport()
</script>
So now everytime a filter is applied to a facet, you can see the filtered result appearing in both Facets and GraphQL columns.

Congratulations, you have finalized this report!
Here is the complete codebase from src/App.vue for your reference:
<script setup>
import '@leanix/reporting'
import { ref, watch } from 'vue'

// reactive variable that will hold the workspace factsheet types
const factSheetTypes = ref([])
// reactive variable that stores some statistics for each factsheet type
const facetResultIndex = ref({})
// reactive variable that stores some statistics for each factsheet type fetch through the GraphQL API
const graphQLResultIndex = ref({})

// we define our report initialization method, it is an async one so that we
// can syncronously await for Promise results
const initializeReport = async () => {
  // Intialize our reporting framework by calling the lx.init method
  // https://leanix.github.io/leanix-reporting/classes/lxr.lxcustomreportlib.html#init
  const setup = await lx.init()

  // we extract the workspace factsheet types from the setup object and store
  // it in our factSheetTypes reactive variable
  // more info on vue ref api found here:
  // https://v3.vuejs.org/guide/reactivity-fundamentals.html#creating-standalone-reactive-values-as-refs
  factSheetTypes.value = Object.keys(setup.settings.dataModel.factSheets)
  // we initialize our grapQLResultIndex so that it preserves same factSheetType order of the facetResultIndex
  graphQLResultIndex.value = factSheetTypes.value.reduce((accumulator, factSheetType) => ({ ...accumulator, [factSheetType]: null }), {})

  // we map each factsheet type into a report facet that we will use
  // to extract the relevant statistics from our workspace
  // https://leanix.github.io/leanix-reporting/interfaces/lxr.reportfacetsconfig.html
  const facets = factSheetTypes.value
    .map((factSheetType, key) => ({
      key: key.toString(),
      fixedFactSheetType: factSheetType,
      attributes: ['completion { completion }'],
      facetFiltersChangedCallback: async filter => {
        graphQLResultIndex.value[factSheetType] = await fetchGraphQLData(factSheetType, filter)
      },
      // everytime this facet gets updated, e.g. when the user sets a filter
      // the callback method will be triggered and the corresponding factsheet type key
      // in the facetResultIndex object will be updated as well
      callback: factSheets => {
        const factSheetCount = factSheets.length
        const averageCompletion = ((factSheets
          .reduce((accumulator, { completion }) => { return accumulator + completion.completion }, 0) / factSheetCount) * 100).toFixed(2) + '%'
        const facetResult = {
          label: lx.translateFactSheetType(factSheetType, 'plural'),
          factSheetCount,
          averageCompletion
        }
        facetResultIndex.value[factSheetType] = facetResult
      }
    }))
  // finally we call the lx.ready method with our report configuration
  // https://leanix.github.io/leanix-reporting/classes/lxr.lxcustomreportlib.html#ready
  lx.ready({ facets })
}

// this method will call the LeanIX GraphQL API and fetch a list of factsheets of a given type
const fetchGraphQLData = async (factSheetType, filter) => {
  // Destructing assignment of filter object with alias for facets and fullTextSearch attributes
  const { facets: facetFilters, fullTextSearchTerm: fullTextSearch, directHits } = filter
  const mappedFilter = { facetFilters, fullTextSearch, ids: directHits.map(({ id }) => id) }
  const query = 'query($filter:FilterInput){allFactSheets(filter:$filter){edges{node{completion{completion}}}}}'
  const queryResult = await lx.executeGraphQL(query, { filter: mappedFilter })
    .then(({ allFactSheets }) => {
      const factSheets = allFactSheets.edges.map(({ node }) => node)
      const factSheetCount = factSheets.length
      const averageCompletion = ((factSheets.reduce((accumulator, { completion }) => { return accumulator + completion.completion }, 0) / factSheetCount) * 100).toFixed(2) + '%'
      return {
        label: lx.translateFactSheetType(factSheetType, 'plural'),
        factSheetCount,
        averageCompletion
      }
    })
  return queryResult
}

// this watcher will be triggered whenever our factSheetTypes array variable gets updated
// and will update the graphQLResultIndex for every factSheetType in that array
/*
watch(factSheetTypes, async factSheetTypes => {
  const factSheetTypeData = await Promise
    .all(factSheetTypes
      .map(factSheetType => fetchGraphQLData(factSheetType))
    )
  factSheetTypes
    .forEach((factSheetType, idx) => {
      graphQLResultIndex.value[factSheetType] = factSheetTypeData[idx]
    })
})
*/

// we call our report initialization method here...
initializeReport()
</script>

<template>
  <div class="container mx-auto h-screen">
    <div class="flex flex-wrap items-start justify-center -mx-8 ">
      <div class="flex flex-col items-center px-8">
        <span class="text-3xl font-bold uppercase py-4">Facets</span>
        <pre>{{facetResultIndex}}</pre>
      </div>
      <div class="flex flex-col items-center px-8">
        <span class="text-3xl font-bold uppercase py-4">GraphQL</span>
        <pre>{{graphQLResultIndex}}</pre>
      </div>
    </div>
  </div>
</template>
Updated over 1 year ago