Querying paginated data in large workspaces
Overview
When developing custom reports that deal with large workspaces, i.e. more than 15k factsheets, it becomes necessary to use special client-side techniques for ensuring a good user experience. This tutorial will cover one of those techniques, the data pagination. Data pagination is particularly useful when the custom report requires to access the full set of workspace factsheets for computing workspace statistics or capture correlations between factsheets. In this tutorial, we'll build a custom report that implements a data pagination technique and give us some performance statistics. More specifically, and given that the LeanIX GraphQL API allFactSheets method imposes a maximum limit of 15k edges on each query, we'll study the impact, in terms of fetching time for our complete dataset, when changing the page size of each query.

Pre-requisites
- NodeJS LTS installed in your computer
- Javascript knowledge
- Vue framework knowledge
Getting Started
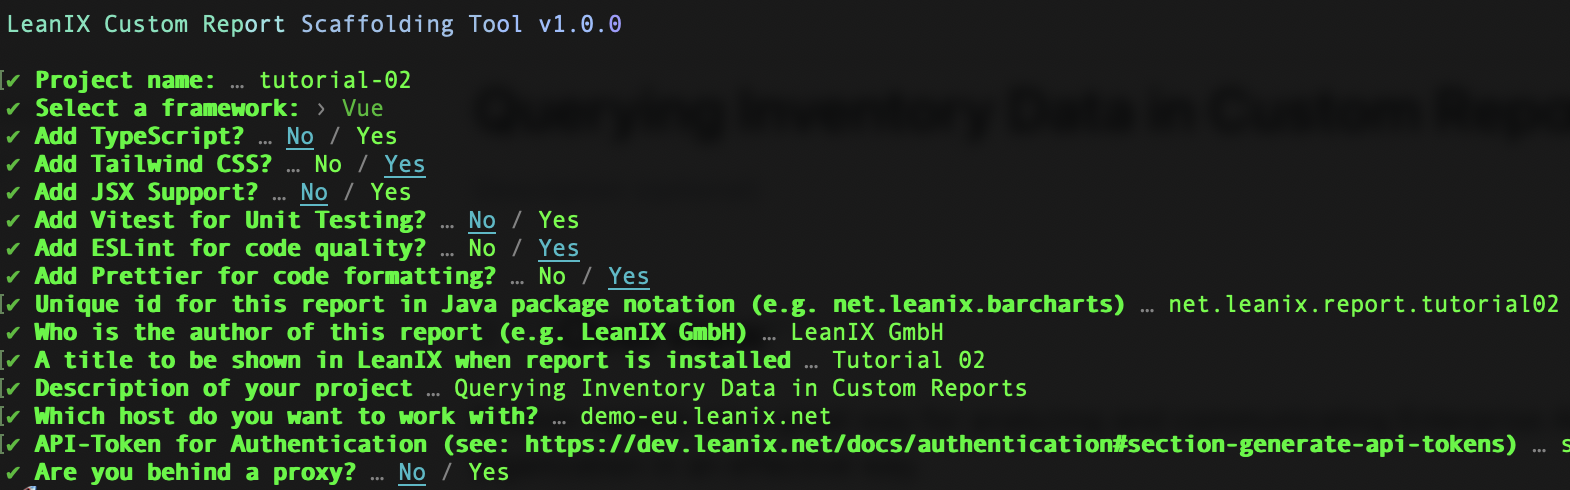
Initialize a new project by running the following command and answering the questionnaire. For this tutorial we will be using the vue template:
npm init lxr@latest
Answer the questionnaire as follows, making sure you answer the last three questions with the appropriate values for your workspace and network:
After this procedure, you should end up with the following project structure:

Finally, before proceeding, we'll delete the ./src/components/HelloWorld.vue file and edit the ./src/App.vue file as follows:
<template>
  <!-- we'll use this template tag for declaring our custom report html -->
  <div>Hi from LeanIX Custom Report</div>
</template>

<script setup>
import { ref, watch } from 'vue'
import '@leanix/reporting'

// page size options for the dropdown selector
const pageSizes = [100, 500, 1000, 15000]
// variable that holds the selected page size option
const pageSize = ref(pageSizes[0])
// holds the last cursor value for the downloaded page
const endCursor = ref(null)
// holds the total workspace factsheet count
const totalFactSheetCount = ref(null)
// holds the downloaded factsheet count
const downloadedFactSheetCount = ref(null)
// holds the completion ratio, i.e. (downloadedFactSheetCount / totalFactSheetCount) * 100
const completionRatio = ref(null)
// holds the time to first results, in miliseconds
const timeToFirstResults = ref(null)
// holds the total download time, in miliseconds
const totalDownloadingTime = ref(null)
// holds the factSheetPerSecond statistic
const factSheetsPerSecond = ref(null)
// holds the time reference t0, download start
const t0 = ref(null)
// holds the timer that will trigger the update of totalDownloadingTime every 1 second
let timer

const initializeReport = async () => {
  await lx.init()
  lx.ready({})
}

const reset = () => {
  // to be implemented later
}

const fetchPage = () => {
  // to be implemented later
}

// watcher for pageSize variable, triggers reset method
watch(pageSize, reset)
// watcher for endCursor variable, triggers fetchPage method
// when variable gets updated or immediately when the report loads
watch(endCursor, fetchPage, { immediate: true })

// we initialize our report here...
initializeReport()
</script>
You may now start the development server now by running the following command:
npm run dev
Note!
When you run npm run dev, a local webserver is hosted on localhost:3000 that allows connections via HTTPS. But since just a development SSL certificate is created the browser might show a warning that the connection is not secure. You could either allow connections to this host anyways, or create your own self-signed certificate.
If you decide to add a security exception to your localhost, make sure you open a second browser tab and point it to https://localhost:3000. Once the security exception is added to your browser, reload the original url of your development server and open the development console. Your should see a screen similar to the one below:

Nothing very exciting happens here. Notice however that our report loads, and is showing the message we defined inside the template tag of the App.vue file.
Implement the custom report layout
Layout
In this section, we'll build our custom report layout. We'll need a selector for allowing the user to set the page size of each query, and placeholders displaying the following statistics: total number of workspace factsheets, number of factsheets downloaded, completion ratio, time to first results, total downloading time, and factsheets per second, as in the example below:

Setup the Template
As a first step, we'll edit the template section of our src/App.vue file and add the layout of our report as follows:
<template>
  <div class="h-screen">
    <div class="max-w-lg grid grid-cols-2 space-y-4">
      <div class="col-span-2"/>
      <label>Page size</label>
      <!-- dropdown selector for pageSize -->
      <select v-model="pageSize">
        <option
          v-for="size in pageSizes"
          :key="size"
          :selected="pageSize === size"
          :value="size">
          {{size}}
        </option>
      </select>
      <label>Workspace factsheet count:</label>
      <!-- placeholder for totalFactSheetCount -->
      <div>{{totalFactSheetCount}}</div>
      <label>Downloaded factsheets:</label>
      <!-- placeholder for downloadedFactSheetCount -->
      <div>{{downloadedFactSheetCount}}</div>
      <label>Completion ratio:</label>
      <!-- placeholder for completionRatio -->
      <div>{{completionRatio}}</div>
      <label>Time to first results:</label>
      <!-- placeholder for timeToFirstResults -->
      <div>{{timeToFirstResults}}</div>
      <label>Total downloading time:</label>
      <!-- placeholder for totalDownloadingTime -->
      <div>{{totalDownloadingTime}}</div>
      <label>Factsheets per second:</label>
      <!-- placeholder for factSheetsPerSecond -->
      <div>{{factSheetsPerSecond}}</div>
    </div>
  </div>
</template>
Implement the reset method
As we've noticed before, we've implemented a couple of watchers in our body tag. One of them triggers a reset method on every update of the pageSize variable. This variable changes every time the user selects the value of the dropdown input. Therefore we will want to reset the whole state of our data fetching process to its default values, including statistics, every time it happens. So, again, let's edit the script section of our src/App.vue file and add the reset as follows:
<script setup>
const reset = () => {
  endCursor.value = null
  totalFactSheetCount.value = null
  downloadedFactSheetCount.value = null
  completionRatio.value = null
  timeToFirstResults.value = null
  totalDownloadingTime.value = null
  factSheetsPerSecond.value = null
  t0.value = null
  // stop the timer
  clearInterval(timer)
  timer = null
  fetchPage()
}
</script>
Implement the fetchPage method
Next, we'll deal with the implementation of the fetchPage method. This method is triggered after every change of the endCursor variable and is responsible for fetching the next batch of factSheets given the pageSize value provided by the user. If you need further details of the LeanIX GraphQL API pagination feature, please check out this article first. So, and again, let's edit the script section of our src/App.vue file and add the fetchPage method right below our reset method:
<script setup>
const fetchPage = async () => {
  const first = pageSize.value
  const after = endCursor.value
  const query = `
    query ($first: Int = 15000, $after: String) {
      allFactSheets(first: $first, after: $after) {
        totalCount
        pageInfo { hasNextPage endCursor }
        edges { node { id } }
      }
    }
  `
  const variables = { first, after }
  const _t0 = performance.now()
  const result = await lx.executeGraphQL(query, variables)
  const deltaT = performance.now() - _t0
  // if the user changed the pageSize while the query was being fetched from the server, and a reset was performed to the state, then discard the results of the query
  if (endCursor.value !== after) return
  // if this is the first page of our dataset (endCursor still null)
  if (after === null) {
    // save t0 into our state variable
    t0.value = _t0
    // compute the timeToFirst results, in miliseconds
    timeToFirstResults.value = Math.round(deltaT) + ' ms'
    // start the timer
    if (timer) clearInterval(timer)
    // set the first value of totalDownloadingTime and factSheetsPerSecond
    totalDownloadingTime.value = timeToFirstResults.value
    factSheetsPerSecond.value = Math.round(downloadedFactSheetCount.value / (deltaT / 1000))
    // and update them every second
    timer = setInterval(() => {
      const deltaT = performance.now() - t0.value
      totalDownloadingTime.value = Math.round(deltaT) + ' ms'
      factSheetsPerSecond.value = Math.round(downloadedFactSheetCount.value / (deltaT / 1000))
    }, 1000)
  }
  // we destructure the query response object into totalCount, hasNextPage, endCursor and edges variables
  const { allFactSheets: { totalCount, pageInfo: { hasNextPage = false, endCursor: _endCursor }, edges } } = result
  totalFactSheetCount.value = totalCount
  // update the downloadedFactSheetCount value
  downloadedFactSheetCount.value += edges.length
  // update the completion ratio
  completionRatio.value = Math.round((downloadedFactSheetCount.value / totalFactSheetCount.value) * 100) + '%'
  // if we just fetched the last page of our dataset then...
  if (hasNextPage === false) {
    // stop the timer
    clearInterval(timer)
    const deltaT = performance.now() - t0.value
    // update the final totalDownloadingTime and factSheetsPerSecond values accordingly
    totalDownloadingTime.value = Math.round(deltaT) + ' ms'
    factSheetsPerSecond.value = Math.round(downloadedFactSheetCount.value / (deltaT / 1000))
  } else endCursor.value = _endCursor // update our endCursor
}
</script>
Notice, again, that the fetchPage method is triggered by the reset method or automatically every time the endCursor variable changes due to the watcher we set on the script section of our src/App.vue file.
Styling our layout
Finally, we add some style to our layout. Edit the template section of our src/App.vue file as follows:
<template>
  <div class="h-screen text-base flex flex-col items-center justify-center">
    <div class="flex flex-col items-center mb-10">
      <div class="text-4xl font-semibold">LeanIX Tutorial</div>
      <div class="text-2xl font-light">Querying paginated data in large workspaces</div>
    </div>
    <div class="w-full max-w-lg grid grid-cols-2 space-y-4 space-x-8 rounded p-4 bg-gray-100 shadow">
      <div class="col-span-2"></div>
      <label class="text-2xl font-semibold">Page size</label>
      <div class="relative">
        <select
          v-model.number="pageSize"
          class="block appearance-none w-full bg-white border border-gray-200 text-gray-700 py-3 px-4 pr-8 rounded leading-tight focus:outline-none focus:bg-white focus:border-gray-500">
          <option
            v-for="size in pageSizes"
            :selected="pageSize === size"
            :value="size"
            :key="size">
            {{size}}
          </option>
        </select>
        <div class="pointer-events-none absolute inset-y-0 right-0 flex items-center px-2 text-gray-700">
          <svg class="fill-current h-4 w-4"  xmlns="http://www.w3.org/2000/svg" viewBox="0 0 20 20"><path d="M9.293 12.95l.707.707L15.657 8l-1.414-1.414L10 10.828 5.757 6.586 4.343 8z"/></svg>
        </div>
      </div>
      <div class="col-span-2 border-t"/>
      <label class="font-semibold">Workspace factsheet count:</label>
      <div>{{totalFactSheetCount}}</div>
      <label class="font-semibold">Downloaded factsheets:</label>
      <div>{{downloadedFactSheetCount}}</div>
      <label class="font-semibold">Completion ratio:</label>
      <div>{{completionRatio}}</div>
      <label class="font-semibold">Time to first results:</label>
      <div>{{timeToFirstResults}}</div>
      <label class="font-semibold">Total downloading time:</label>
      <div>{{totalDownloadingTime}}</div>
      <label class="font-semibold">Factsheets per second:</label>
      <div>{{factSheetsPerSecond}}</div>
    </div>
  </div>
</template>
Now that we have all the pieces of our custom report in place, let's start it by running the start command:
npm start
You should now have an output like the picture below, and see the progress of all statistics while the data is being fetched. If that's the case, then congratulations. If not, then check your developer console for eventual errors and double-check your source code.

Analyze page size vs download time
While changing the page size, observe the different metrics shown. More specifically, notice the impact that it has on all different metrics shown. Keep in mind that, currently, the LeanIX GraphQL API has a maximum page size of 15k edges for each query. You’ll realize that, on average, the higher the page size the quicker it is to fetch a large dataset, at the expense of a higher time to first result. This is an important factor to take into account when thinking about your Custom Report UX, more specifically the Time to Interactive metric, i.e., how much does it take to make your report fully interactive. Therefore, and depending on the size of your workspace and custom report use case, an adaptive pagination algorithm that yields a small time to first results while minimizing the total download time would be an interesting feature for enhancing your Custom Report's UX.
Here is the complete codebase from src/App.vue for your reference:
<script setup>
import { ref, watch } from 'vue'
import '@leanix/reporting'

const pageSizes = [100, 500, 1000, 15000]
const pageSize = ref(pageSizes[0])
const endCursor = ref(null)
const totalFactSheetCount = ref(null)
const downloadedFactSheetCount = ref(null)
const completionRatio = ref(null)
const timeToFirstResults = ref(null)
const totalDownloadingTime = ref(null)
const factSheetsPerSecond = ref(null)
const t0 = ref(null)
let timer = null

const initializeReport = async () => {
  await lx.init()
  lx.ready({})
}

const reset = () => {
  endCursor.value = null
  totalFactSheetCount.value = null
  downloadedFactSheetCount.value = null
  completionRatio.value = null
  timeToFirstResults.value = null
  totalDownloadingTime.value = null
  factSheetsPerSecond.value = null
  t0.value = null
  // stop the timer
  clearInterval(timer)
  timer = null
  fetchPage()
}

const fetchPage = async () => {
  const first = pageSize.value
  const after = endCursor.value
  const query = `
    query ($first: Int = 15000, $after: String) {
      allFactSheets(first: $first, after: $after) {
        totalCount
        pageInfo { hasNextPage endCursor }
        edges { node { id } }
      }
    }
  `
  const variables = { first, after }
  const _t0 = performance.now()
  const result = await lx.executeGraphQL(query, variables)
  const deltaT = performance.now() - _t0
  // if the user changed the pageSize while the query was being fetched from the server, and a reset was performed to the state, then discard the results of the query
  if (endCursor.value !== after) return
  // if this is the first page of our dataset (endCursor still null)
  if (after === null) {
    // save t0 into our state variable
    t0.value = _t0
    // compute the timeToFirst results, in miliseconds
    timeToFirstResults.value = Math.round(deltaT) + ' ms'
    // start the timer
    if (timer) clearInterval(timer)
    // set the first value of totalDownloadingTime and factSheetsPerSecond
    totalDownloadingTime.value = timeToFirstResults.value
    factSheetsPerSecond.value = Math.round(downloadedFactSheetCount.value / (deltaT / 1000))
    // and update them every second
    timer = setInterval(() => {
      const deltaT = performance.now() - t0.value
      totalDownloadingTime.value = Math.round(deltaT) + ' ms'
      factSheetsPerSecond.value = Math.round(downloadedFactSheetCount.value / (deltaT / 1000))
    }, 1000)
  }
  // we destructure the query response object into totalCount, hasNextPage, endCursor and edges variables
  const { allFactSheets: { totalCount, pageInfo: { hasNextPage = false, endCursor: _endCursor }, edges } } = result
  totalFactSheetCount.value = totalCount
  // update the downloadedFactSheetCount value
  downloadedFactSheetCount.value += edges.length
  // update the completion ratio
  completionRatio.value = Math.round((downloadedFactSheetCount.value / totalFactSheetCount.value) * 100) + '%'
  // if we just fetched the last page of our dataset then...
  if (hasNextPage === false) {
    // stop the timer
    clearInterval(timer)
    const deltaT = performance.now() - t0.value
    // update the final totalDownloadingTime and factSheetsPerSecond values accordingly
    totalDownloadingTime.value = Math.round(deltaT) + ' ms'
    factSheetsPerSecond.value = Math.round(downloadedFactSheetCount.value / (deltaT / 1000))
  } else endCursor.value = _endCursor // update our endCursor
}

// watcher for pageSize variable, triggers reset method
watch(pageSize, reset)
// watcher for endCursor variable, triggers fetchPage method
watch(endCursor, fetchPage, { immediate: true })

initializeReport()
</script>

<template>
  <div class="h-screen text-base flex flex-col items-center justify-center">
    <div class="flex flex-col items-center mb-10">
      <div class="text-4xl font-semibold">LeanIX Tutorial</div>
      <div class="text-2xl font-light">Querying paginated data in large workspaces</div>
    </div>
    <div class="w-full max-w-lg grid grid-cols-2 space-y-4 space-x-8 rounded p-4 bg-gray-100 shadow">
      <div class="col-span-2"></div>
      <label class="text-2xl font-semibold">Page size</label>
      <div class="relative">
        <select
          v-model.number="pageSize"
          class="block appearance-none w-full bg-white border border-gray-200 text-gray-700 py-3 px-4 pr-8 rounded leading-tight focus:outline-none focus:bg-white focus:border-gray-500">
          <option
            v-for="size in pageSizes"
            :selected="pageSize === size"
            :value="size"
            :key="size">
            {{size}}
          </option>
        </select>
        <div class="pointer-events-none absolute inset-y-0 right-0 flex items-center px-2 text-gray-700">
          <svg class="fill-current h-4 w-4"  xmlns="http://www.w3.org/2000/svg" viewBox="0 0 20 20"><path d="M9.293 12.95l.707.707L15.657 8l-1.414-1.414L10 10.828 5.757 6.586 4.343 8z"/></svg>
        </div>
      </div>
      <div class="col-span-2 border-t"/>
      <label class="font-semibold">Workspace factsheet count:</label>
      <div>{{totalFactSheetCount}}</div>
      <label class="font-semibold">Downloaded factsheets:</label>
      <div>{{downloadedFactSheetCount}}</div>
      <label class="font-semibold">Completion ratio:</label>
      <div>{{completionRatio}}</div>
      <label class="font-semibold">Time to first results:</label>
      <div>{{timeToFirstResults}}</div>
      <label class="font-semibold">Total downloading time:</label>
      <div>{{totalDownloadingTime}}</div>
      <label class="font-semibold">Factsheets per second:</label>
      <div>{{factSheetsPerSecond}}</div>
    </div>
  </div>
</template>
Updated 6 months ago